The problem
Like many people, I always relied on the utilization statistics displayed on my gym’s website to plan my workouts. However, I noticed that these statistics were imprecise and failed to provide real-time insights. The wish for accurate and up-to-date data motivated me to find a solution.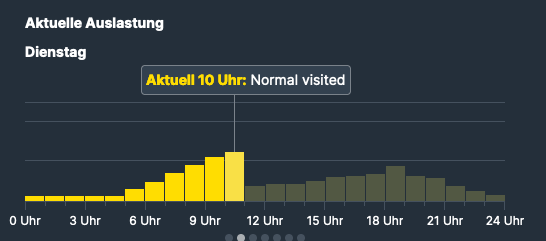
Exploring the gyms website
To gather raw data, I delved into the backend of my gym’s website. The utilization statistics displayed on the website were visually appealing but lacked precision. Moreover, the future prediction feature seemed even more unreliable. I decided to explore the network requests and responses made by the website to uncover the raw information.
I started by logging in to the gym’s website using my credentials.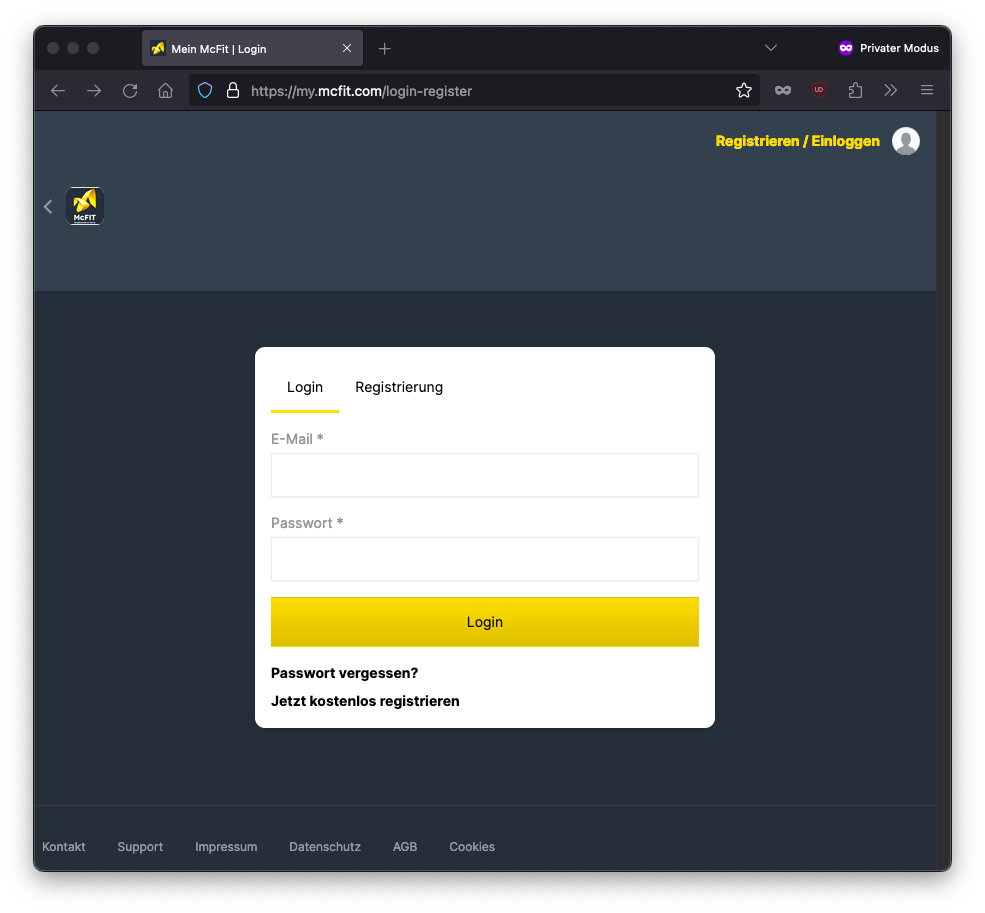
Once logged in, I navigated through the location list to find my specific gym.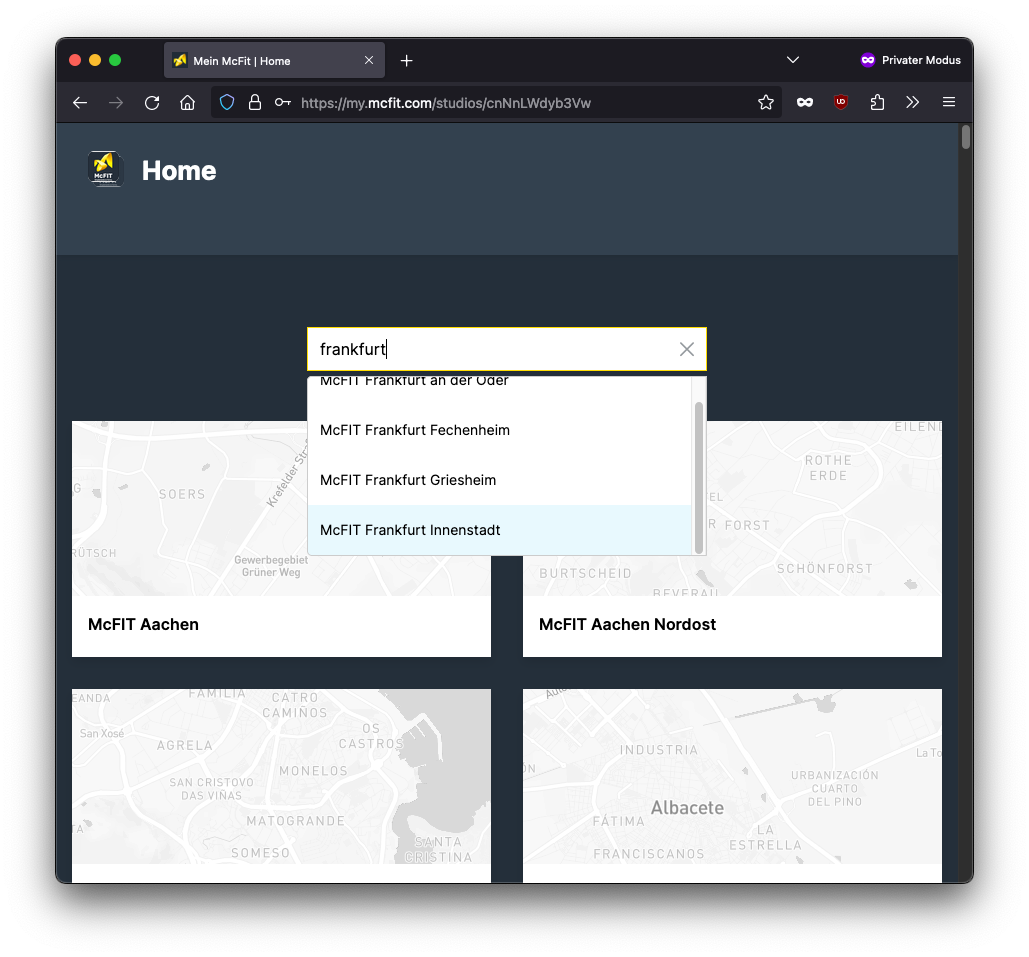
With the developer tools open, I reloaded the gym’s webpage to trigger the network requests. As the requests were made, I observed the network tab to monitor the activity.
To filter the requests related to utilization data, I used the search functionality within the network tab. By entering keywords like “util” or “utilization,” I narrowed down the results to relevant requests.
Among the filtered requests, I identified a JSON response labeled “today.” This response contained the desired utilization data for the current day. Examining the response further, I found the relevant metrics.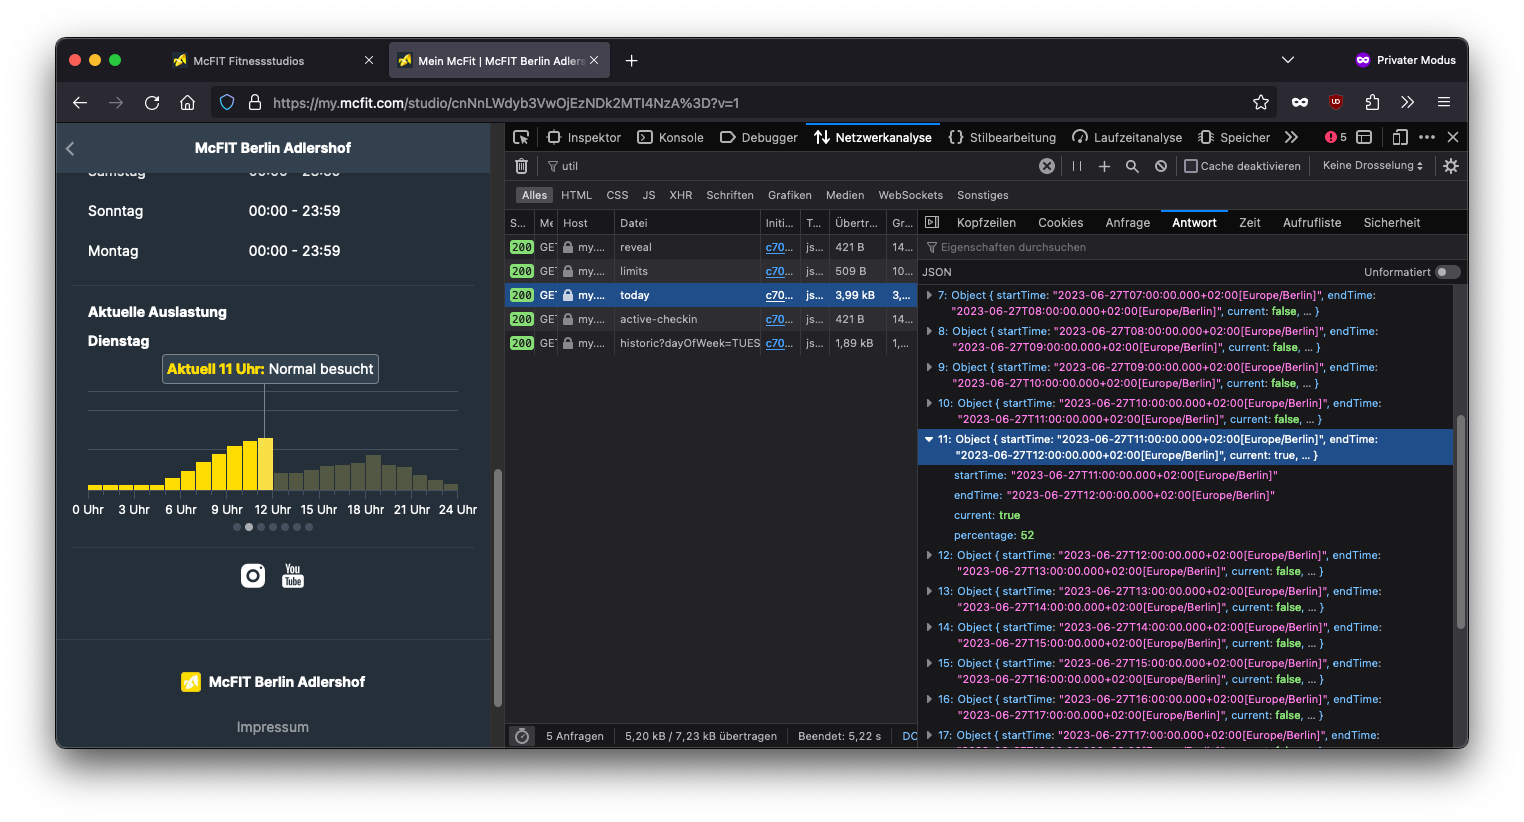
I right-clicked on the response and selected “Copy Fetch”. This action copied the complete request URL, along with header data and parameters used to fetch the utilization data from the server.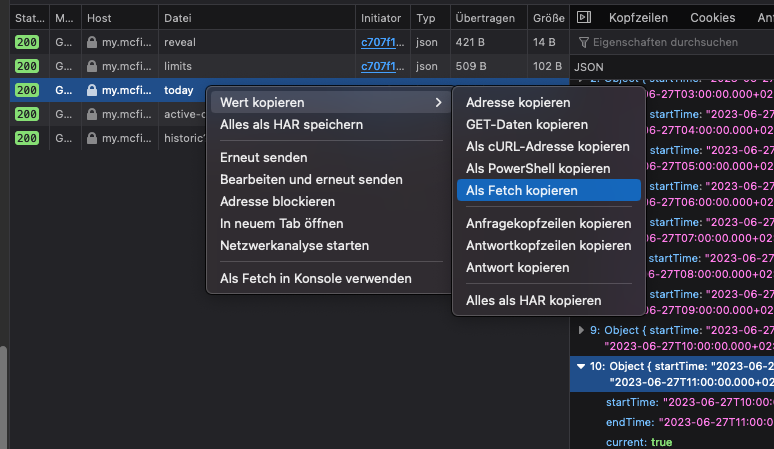
Armed with this information, I proceeded to the next step of building a Prometheus exporter in Go. By leveraging this exporter and Grafana, I would be able to transform the raw utilization data into a visually appealing and precise dashboard for monitoring gym utilization.
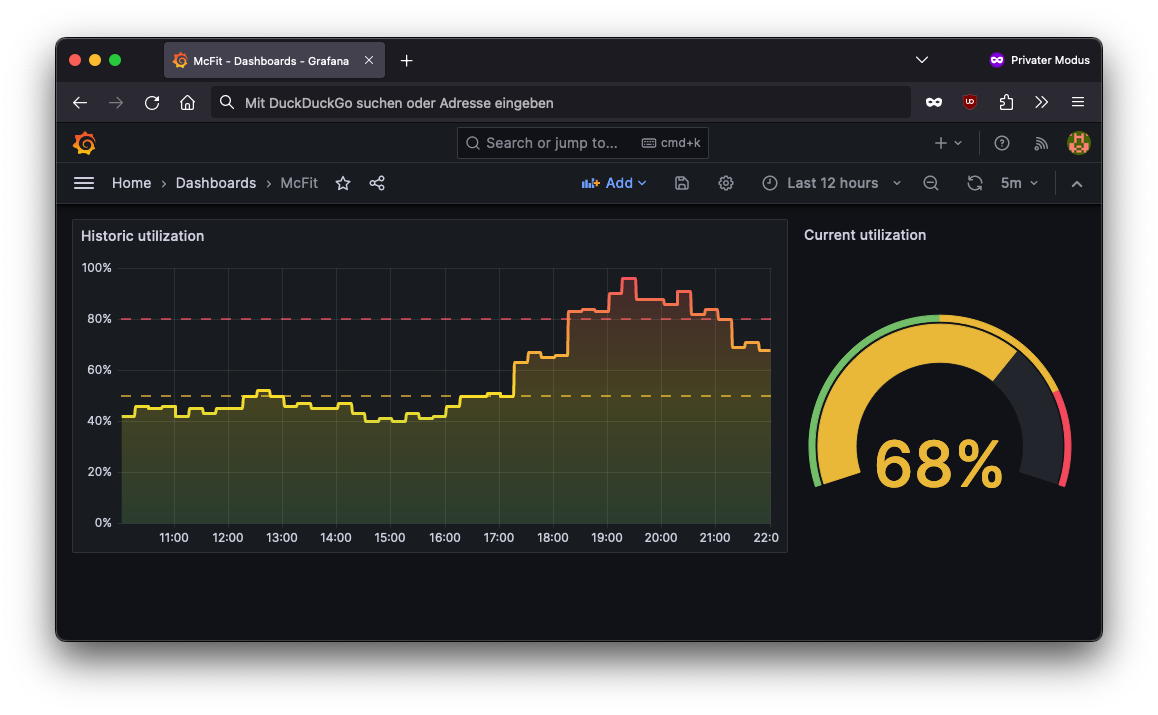
After successfully implementing the Prometheus exporter, I installed Grafana on my Raspberry Pi and configured it to connect with the Prometheus data source.
At first I updated the Prometheus config file (/etc/prometheus/prometheus.yaml).
scrape_configs:
- job_name: prometheus
  honor_timestamps: true
  scrape_interval: 5s
  scrape_timeout: 5s
  metrics_path: /metrics
  scheme: http
  static_configs:
  - targets:
    - localhost:9090
- job_name: mcfit
  honor_timestamps: true
  scrape_interval: 15s
  scrape_timeout: 10s
  metrics_path: /metrics
  scheme: http
  static_configs:
  - targets:
    - localhost:2112
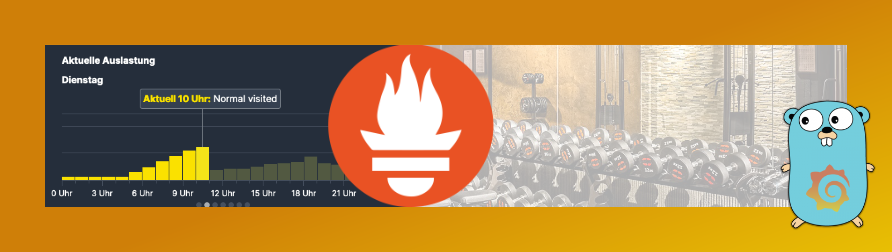
Then I created a new Dashboard and built some visualizations.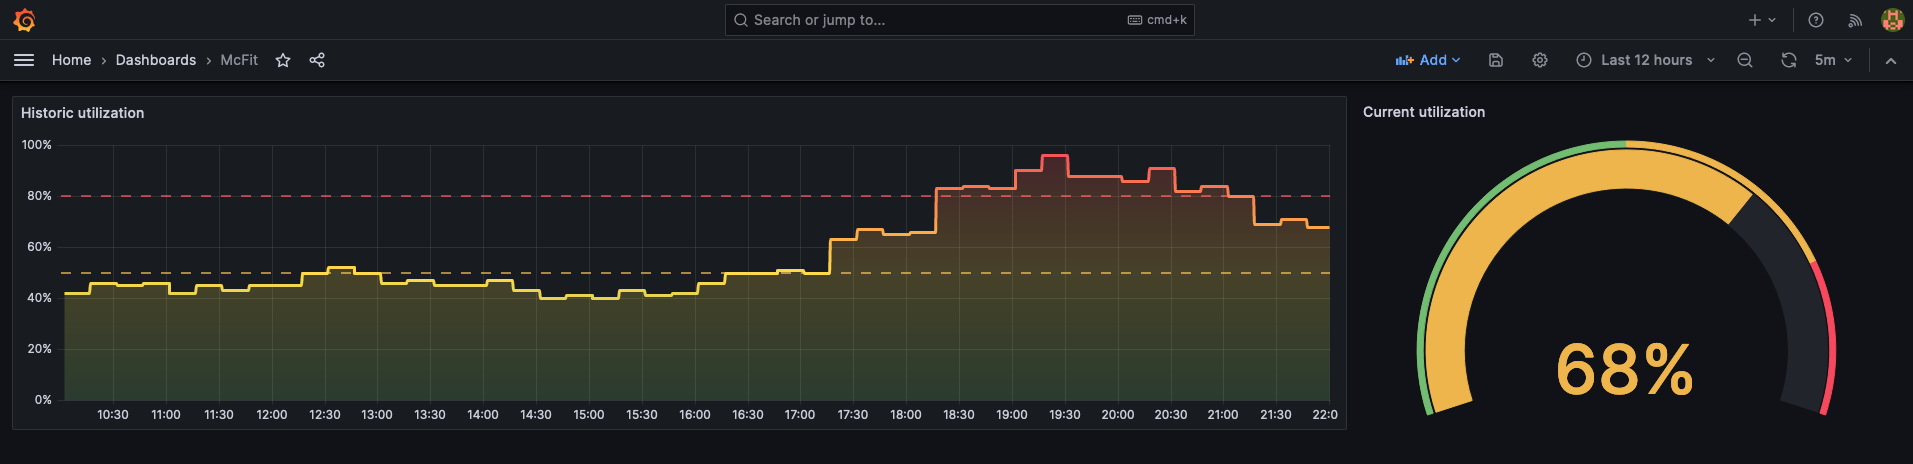
Final thoughts
Through the process outlined above, I was able to overcome the limitations of imprecise utilization statistics provided on my gym’s website. By building a custom Prometheus exporter in Go and integrating it with Grafana, I achieved an accurate monitoring system for my gyms utilization. Embracing data-driven decision-making, I can now optimize my workout routines and ensure a better gym experience.
If you want to use the exporter for yourself, you can download the source code on GitHub. But keep in mind, that at the moment it only works for McFIT gyms.
GitHub repository