In cybersecurity, staying ahead of threats is a constant challenge. A powerful technique for gathering insights about threats is log analysis. Logs contain detailed insights into system activities and are a good way to discover potential vulnerabilities and malicious behavior. In this post, I will explore the use of Jupyter Notebooks and Python for effective log analysis, focusing on three log files: SSH logs, SMTP logs, and Nginx logs.
Jupyter is a powerful data analysis tool that can be used to uncover patterns and anomalies within these logs, providing a deeper understanding of potential security threats.
Setting up the environment
First I created a new Jupyter Notebook and did some basic imports:
import pandas as pd
import numpy as np
import re
import matplotlib.pyplot as plt
from datetime import datetime
Analyze failed SSH Logins
Analyzing failed SSH logins on a Debian system is essential for detecting potential brute force attacks and unauthorized access attempts. Debian, like other Linux distributions, records these attempts in the /var/log/auth.log file. By using Jupyter Notebooks and Python, it is possible to efficiently parse and examine this data to identify suspicious patterns. This process involves filtering logs for failed login attempts, visualizing trends, and identifying anomalies.
The first step after setting up the environment is to open the log data:
# Open logs
with open('/var/log/auth.log', 'r') as log_file:
    log_data = log_file.read()
Parse Logdata
After that comes the most complicated part of the process. Parsing the logdata into a Pandas DataFrame for further anaylsis. The provided code extracts failed SSH login attempts from log files using regex patterns to identify key details such as date, time, server, and user information. It parses these entries into a structured pandas DataFrame, making analysis and visualization easier.
# Define Regex patterns
sshd_authentication_pattern = r'(\w{3} \d{2} \d{2}:\d{2}:\d{2}) (\w+) sshd\[(\d+)\]: (Failed password for (invalid user )?(.+) from (\d+\.\d+\.\d+\.\d+) port (\d+))'
pattern_invalid_user = r'(\w{3} \d{2} \d{2}:\d{2}:\d{2}) (\w+) sshd\[(\d+)\]: Invalid user (.+) from (\d+\.\d+\.\d+\.\d+) port (\d+)'

# Parse logdata
parsed_logs = []
for line in log_data.split('\n'):
    match_failed_password = re.match(sshd_authentication_pattern, line)
    match_invalid_user = re.match(pattern_invalid_user, line)

    if match_failed_password:
        datetime, server, pid, full_message, invalid_user_flag, user, ip, port = match_failed_password.groups()
        message = 'Failed password'
        is_invalid_user = invalid_user_flag is not None  # Check for 'invalid user' flag
        parsed_logs.append((datetime, server, pid, message, user, ip, port, is_invalid_user))
    elif match_invalid_user:
        datetime, server, pid, user, ip, port = match_invalid_user.groups()
        message = 'Invalid user'
        is_invalid_user = True
        parsed_logs.append((datetime, server, pid, message, user, ip, port, is_invalid_user))


columns = ['DateTime', 'Server', 'ProcessID', 'Message', 'User', 'RemoteIP', 'Port', 'InvalidUser']
df = pd.DataFrame(parsed_logs, columns=columns)  # Only use parsed logs

df['DateTime'] = pd.to_datetime(df['DateTime'], format='%b %d %H:%M:%S')
Then I previewed the Dataframe to see if it looks correct:
df.head(10)
| DateTime | Server | ProcessID | Message | User | RemoteIP | Port | InvalidUser | |
|---|---|---|---|---|---|---|---|---|
| 0 | 2023-07-20 22:59:20 | deb-host-01 | 690007 | Failed password | steve | 172.232.53.14 | 65154 | False |
| 1 | 2023-07-21 19:57:52 | deb-host-01 | 8105 | Failed password | steve | 172.232.53.14 | 64993 | False |
| 2 | 2023-12-23 05:17:13 | deb-host-01 | 1365030 | Invalid user | zx | 172.232.53.14 | 59120 | True |
| 3 | 2023-12-23 05:17:13 | deb-host-01 | 1365031 | Invalid user | hndsm87 | 172.232.53.14 | 59126 | True |
| 4 | 2023-12-23 05:17:13 | deb-host-01 | 1365029 | Invalid user | cbtlebah | 172.232.53.14 | 59104 | True |
| 5 | 2023-12-23 05:17:13 | deb-host-01 | 1365035 | Invalid user | acs | 172.232.53.14 | 59160 | True |
| 6 | 2023-12-23 05:17:13 | deb-host-01 | 1365032 | Invalid user | smk3 | 172.232.53.14 | 59142 | True |
| 7 | 2023-12-23 05:17:13 | deb-host-01 | 1365052 | Invalid user | xjw | 172.232.53.14 | 59364 | True |
| 8 | 2023-12-23 05:17:13 | deb-host-01 | 1365051 | Invalid user | xjw | 172.232.53.14 | 59356 | True |
| 9 | 2023-12-23 05:17:13 | deb-host-01 | 1365054 | Invalid user | xjw | 172.232.53.14 | 59410 | True |
Then I checked, if all columns having the correct datatype, for better analysis. Espacially the DateTime column is important:
df.dtypes
DateTime       datetime64[ns]
Server                 object
ProcessID              object
Message                object
User                   object
RemoteIP               object
Port                   object
InvalidUser              bool
dtype: object
Show top 10 usernames with failed logins
To identify the top 10 most common usernames from failed login attempts, the analysis involves aggregating the parsed log data by username and counting occurrences. This step highlights frequently targeted usernames, potentially signaling brute-force attack patterns or specific accounts at risk.
username_counts = df['User'].value_counts()
username_counts.head(10)
root           37
test            6
xdp             6
xjw             6
huanyushi       6
ubuntu          6
ccl             4
liezhisheng     4
jiangzite       4
weiwenjie       4
Name: User, dtype: int64
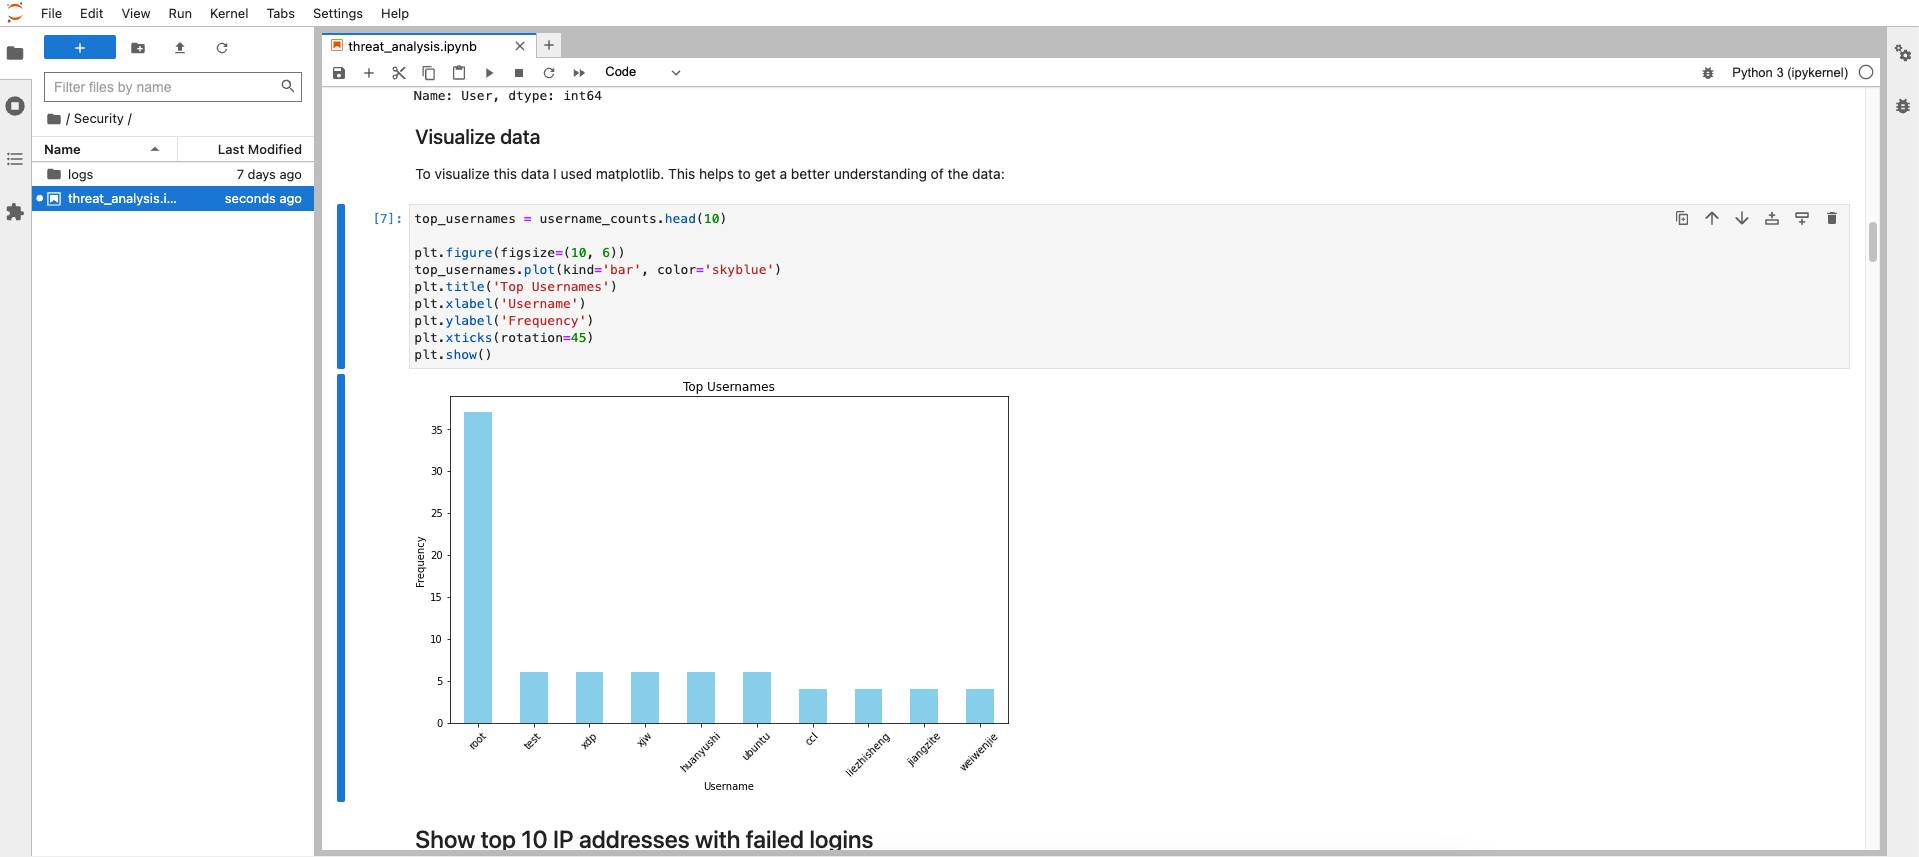
Visualize data
To visualize this data I used matplotlib. This helps to get a better understanding of the data:
top_usernames = username_counts.head(10)

plt.figure(figsize=(10, 6))
top_usernames.plot(kind='bar', color='skyblue')
plt.title('Top Usernames')
plt.xlabel('Username')
plt.ylabel('Frequency')
plt.xticks(rotation=45)
plt.show()
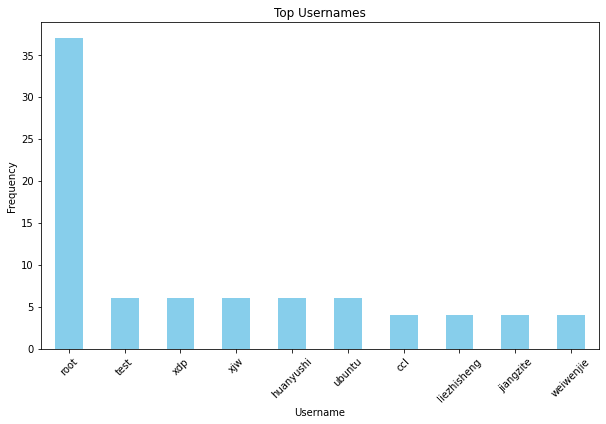
Not suprising the username root is targeted the most by attackers. Far behind on the second place is the username test. Attackers may hope to find some forgotten accounts with weak credentials with this account.
Show top 10 IP addresses with failed logins
To pinpoint the top 10 IP addresses with the most failed login attempts, the process sorts and counts the IP addresses from the parsed log data. This approach reveals the sources of the most persistent or potentially malicious access attempts, allowing for targeted security interventions, such as blocking or monitoring these IPs more closely to mitigate risk.
remoteIP_counts = df['RemoteIP'].value_counts()
remoteIP_counts.head(10)
172.232.53.14    572
103.144.245.127    2
120.36.239.72      2
Name: RemoteIP, dtype: int64
For more context it would be possible to enrich this data using various OSINT services like AbuseIPDB or similar services. This way it is possible to identify from which countries the most attacks come from.
Show top 10 ports with failed logins
Identifying the top 10 ports from failed logins helps focus on common attack vectors, aiding in tightening security on these frequently targeted ports.
ports_counts = df['Port'].value_counts()
ports_counts.head(10)
57842    2
56604    2
55140    2
54408    2
53846    2
52896    2
52332    2
52260    2
38016    2
37920    2
Name: Port, dtype: int64
In my case there is no specific port that stands out. Usually port 22 (SSH) would be attacked the most. But because I have a very strict blocking policy on failed login attempts, this result looks different than usually.
Failed SMTP logins
Analyzing failed SMTP logins is important for identifying attempted email breaches and safeguarding email servers. Similar to SSH log analysis, Debian systems log SMTP activities, capturing both successful and failed login attempts within various log files, such as /var/log/mail.log. Leveraging the analytical power of Python and Jupyter Notebooks again, it’s feasible to sift through these SMTP logs to detect anomalous login attempts. This analysis involves extracting relevant data points from the logs, such as timestamp, sender, recipient, and error messages related to failed logins. By filtering for these failed attempts and examining their patterns, it is possible to spot potential threats and take proactive steps to reinforce email security protocols.
Before starting the analysis I need to open the logfile again:
with open('/var/log/mail.log', 'r') as log_file:
    log_data = log_file.readlines()
parsed_data = []

log_pattern = re.compile(
    r'(\w+-\w+-\d+)\s+\|'  # Host
    r'\s+(\w+\s+\d+\s+\d+:\d+:\d+)'  # Timestamp
    r'\s+(\w+)\s+'  # ID
    r'postfix\/(\w+)\/(\w+)\[(\d+)\]:'  # Service, Process, PID
    r'\s+warning:\s+unknown\[(\d+\.\d+\.\d+\.\d+)\]:'  # IP Address
    r'\s+SASL LOGIN authentication failed: .+?,'
    r'\s+sasl_username=(.+)'  # SASL Username
)

for line in log_data:
    match = log_pattern.search(line)
    if match:
        host, timestamp, container_id, process, sub_process, pid, ip_address, sasl_username = match.groups()
        parsed_data.append({
            'Timestamp': timestamp,
            'IP Address': ip_address,
            'SASL Username': sasl_username,
            'Action': 'SASL LOGIN',
            'Outcome': 'Authentication Failed',
            'PID': pid,
            'Process': f'{process}/{sub_process}',
            'Host': host,
            'Raw Line': line
        })

df = pd.DataFrame(parsed_data)

# Preview the DataFrame
df
| Timestamp | IP Address | SASL Username | Action | Outcome | PID | Process | Host | Raw Line | |
|---|---|---|---|---|---|---|---|---|---|
| 0 | Jan 25 22:53:19 | 194.169.175.10 | video@emaildomain.com | SASL LOGIN | Authentication Failed | 361 | smtps/smtpd | postfix-host-1 | postfix-host-1 | Jan 25 22:53:19 2bcdd92a38... |
| 1 | Jan 25 22:54:01 | 141.98.11.68 | guest@emaildomain.com | SASL LOGIN | Authentication Failed | 361 | smtps/smtpd | postfix-host-1 | postfix-host-1 | Jan 25 22:54:01 2bcdd92a38... |
| 2 | Jan 25 22:54:03 | 194.169.175.10 | sekretariat@emaildomain.com | SASL LOGIN | Authentication Failed | 381 | smtps/smtpd | postfix-host-1 | postfix-host-1 | Jan 25 22:54:03 2bcdd92a38... |
| 3 | Jan 25 22:54:51 | 194.169.175.10 | secretaria@emaildomain.com | SASL LOGIN | Authentication Failed | 381 | smtps/smtpd | postfix-host-1 | postfix-host-1 | Jan 25 22:54:51 2bcdd92a38... |
| 4 | Jan 25 22:54:55 | 141.98.11.68 | sales01@emaildomain.com | SASL LOGIN | Authentication Failed | 361 | smtps/smtpd | postfix-host-1 | postfix-host-1 | Jan 25 22:54:55 2bcdd92a38... |
| ... | ... | ... | ... | ... | ... | ... | ... | ... | ... |
| 1430 | Feb 9 13:17:13 | 194.169.175.10 | shutdown@emaildomain.com | SASL LOGIN | Authentication Failed | 10537 | smtps/smtpd | postfix-host-1 | postfix-host-1 | Feb 9 13:17:13 2bcdd92a38... |
| 1431 | Feb 9 13:18:30 | 194.169.175.10 | halt@emaildomain.com | SASL LOGIN | Authentication Failed | 10531 | smtps/smtpd | postfix-host-1 | postfix-host-1 | Feb 9 13:18:30 2bcdd92a38... |
| 1432 | Feb 9 13:19:45 | 194.169.175.10 | mail@emaildomain.com | SASL LOGIN | Authentication Failed | 10537 | smtps/smtpd | postfix-host-1 | postfix-host-1 | Feb 9 13:19:45 2bcdd92a38... |
| 1433 | Feb 9 13:21:02 | 194.169.175.10 | news@emaildomain.com | SASL LOGIN | Authentication Failed | 10531 | smtps/smtpd | postfix-host-1 | postfix-host-1 | Feb 9 13:21:02 2bcdd92a38... |
| 1434 | Feb 9 13:22:18 | 194.169.175.10 | newsletter@emaildomain.com | SASL LOGIN | Authentication Failed | 10537 | smtps/smtpd | postfix-host-1 | postfix-host-1 | Feb 9 13:22:18 2bcdd92a38... |
1435 rows × 9 columns
Filter for failed authentications
failed_auth_df = df[df['Outcome'] == 'Authentication Failed']
failed_auth_df
| Timestamp | IP Address | SASL Username | Action | Outcome | PID | Process | Host | Raw Line | |
|---|---|---|---|---|---|---|---|---|---|
| 0 | Jan 25 22:53:19 | 194.169.175.10 | video@emaildomain.com | SASL LOGIN | Authentication Failed | 361 | smtps/smtpd | postfix-host-1 | postfix-host-1 | Jan 25 22:53:19 2bcdd92a38... |
| 1 | Jan 25 22:54:01 | 141.98.11.68 | guest@emaildomain.com | SASL LOGIN | Authentication Failed | 361 | smtps/smtpd | postfix-host-1 | postfix-host-1 | Jan 25 22:54:01 2bcdd92a38... |
| 2 | Jan 25 22:54:03 | 194.169.175.10 | sekretariat@emaildomain.com | SASL LOGIN | Authentication Failed | 381 | smtps/smtpd | postfix-host-1 | postfix-host-1 | Jan 25 22:54:03 2bcdd92a38... |
| 3 | Jan 25 22:54:51 | 194.169.175.10 | secretaria@emaildomain.com | SASL LOGIN | Authentication Failed | 381 | smtps/smtpd | postfix-host-1 | postfix-host-1 | Jan 25 22:54:51 2bcdd92a38... |
| 4 | Jan 25 22:54:55 | 141.98.11.68 | sales01@emaildomain.com | SASL LOGIN | Authentication Failed | 361 | smtps/smtpd | postfix-host-1 | postfix-host-1 | Jan 25 22:54:55 2bcdd92a38... |
| ... | ... | ... | ... | ... | ... | ... | ... | ... | ... |
| 1430 | Feb 9 13:17:13 | 194.169.175.10 | shutdown@emaildomain.com | SASL LOGIN | Authentication Failed | 10537 | smtps/smtpd | postfix-host-1 | postfix-host-1 | Feb 9 13:17:13 2bcdd92a38... |
| 1431 | Feb 9 13:18:30 | 194.169.175.10 | halt@emaildomain.com | SASL LOGIN | Authentication Failed | 10531 | smtps/smtpd | postfix-host-1 | postfix-host-1 | Feb 9 13:18:30 2bcdd92a38... |
| 1432 | Feb 9 13:19:45 | 194.169.175.10 | mail@emaildomain.com | SASL LOGIN | Authentication Failed | 10537 | smtps/smtpd | postfix-host-1 | postfix-host-1 | Feb 9 13:19:45 2bcdd92a38... |
| 1433 | Feb 9 13:21:02 | 194.169.175.10 | news@emaildomain.com | SASL LOGIN | Authentication Failed | 10531 | smtps/smtpd | postfix-host-1 | postfix-host-1 | Feb 9 13:21:02 2bcdd92a38... |
| 1434 | Feb 9 13:22:18 | 194.169.175.10 | newsletter@emaildomain.com | SASL LOGIN | Authentication Failed | 10537 | smtps/smtpd | postfix-host-1 | postfix-host-1 | Feb 9 13:22:18 2bcdd92a38... |
1435 rows × 9 columns
Visualize data
import matplotlib.pyplot as plt

# Group the filtered DataFrame by the "Username" column and count the occurrences
username_counts = failed_auth_df['SASL Username'].value_counts()

# Plot the top 10 most common usernames
top_username_counts = username_counts.head(10)
top_username_counts.plot(kind='bar', figsize=(10, 6), color='skyblue')

plt.title('Top 10 Most Common Usernames with Authentication Failures')
plt.xlabel('Username')
plt.ylabel('Count')

plt.xticks(rotation=45, ha='right')

plt.tight_layout()
plt.show()
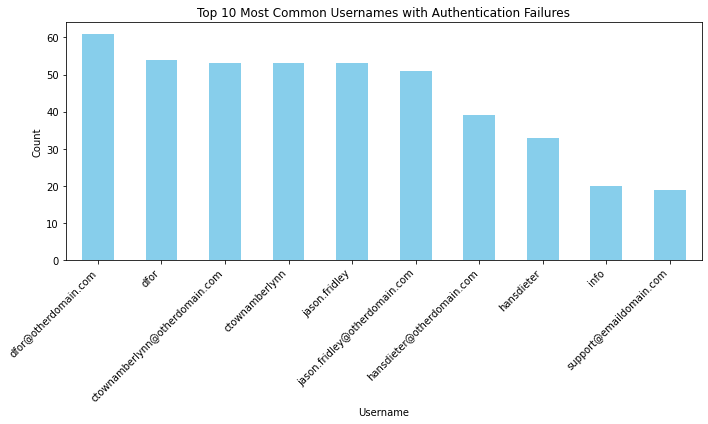
top_username_counts
dfor@otherdomain.com              61
dfor                              54
ctownamberlynn@otherdomain.com    53
ctownamberlynn                    53
jason.fridley                     53
jason.fridley@otherdomain.com     51
hansdieter@otherdomain.com        39
hansdieter                        33
info                              20
support@emaildomain.com           19
Name: SASL Username, dtype: int64
# Group the filtered DataFrame by the "IP Address" column and count the occurrences
ip_counts = failed_auth_df['IP Address'].value_counts()

top_ip_counts = ip_counts.head(10)
top_ip_counts.plot(kind='bar', figsize=(10, 6), color='skyblue')

plt.title('Top 10 Most Common IP Addresses with Authentication Failures')
plt.xlabel('IP Address')
plt.ylabel('Count')

plt.xticks(rotation=45, ha='right')

plt.tight_layout()
plt.show()
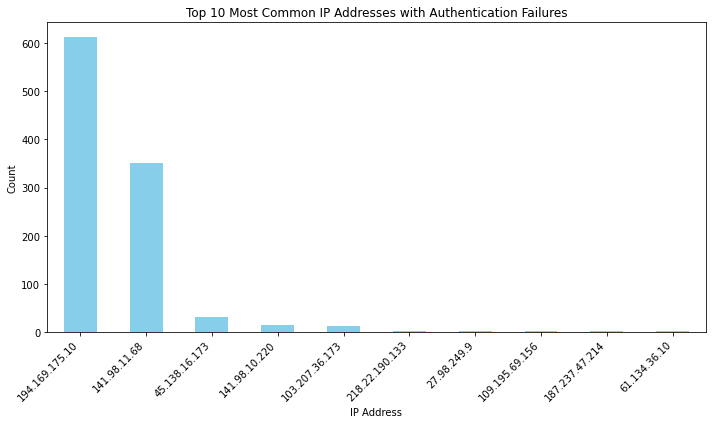
top_ip_counts
194.169.175.10    612
141.98.11.68      350
45.138.16.173      32
141.98.10.220      14
103.207.36.173     13
218.22.190.133      3
27.98.249.9         3
109.195.69.156      3
187.237.47.214      3
61.134.36.10        2
Name: IP Address, dtype: int64
These IP addresses could be used to feed firewall block lists on my server.
NGINX
The last part of this analysis will be the analysis of the webserver logs, of an nginx webserver. At first I will open the logs and parse them into a Pandas DataFrame again:
with open('logs/nginx.log', 'r') as log_file:
    log_data = log_file.readlines()
pattern = r'^.*?(\d+\.\d+\.\d+\.\d+|\w+:\w+:\w+:\w+:\w+:\w+:\w+:\w+) - - \[(.*?)\] "(.*?)" (\d+) (\d+) "(.*?)" "(.*?)"$'

ips = []
timestamps = []
methods = []
urls = []
statuses = []
bytes_sent = []
referrers = []
user_agents = []


for line in log_data:
    match = re.match(pattern, line)
    if match:
        ips.append(match.group(1))
        timestamps.append(match.group(2))
        method, url, _ = match.group(3).split()
        methods.append(method)
        urls.append(url)
        statuses.append(int(match.group(4)))
        bytes_sent.append(int(match.group(5)))
        referrers.append(match.group(6))
        user_agents.append(match.group(7))

df = pd.DataFrame({
    'IP': ips,
    'Timestamp': timestamps,
    'Method': methods,
    'URL': urls,
    'Status': statuses,
    'BytesSent': bytes_sent,
    'Referrer': referrers,
    'UserAgent': user_agents
})

df['Timestamp'] = pd.to_datetime(df['Timestamp'], format='%d/%b/%Y:%H:%M:%S %z')

df
| IP | Timestamp | Method | URL | Status | BytesSent | Referrer | UserAgent | |
|---|---|---|---|---|---|---|---|---|
| 0 | 172.22.1.9 | 2024-01-25 22:52:47+01:00 | HEAD | /settings.php | 200 | 0 | - | rspamd-3.7.5 |
| 1 | 172.22.1.9 | 2024-01-25 22:52:47+01:00 | GET | /settings.php | 200 | 1174 | - | rspamd-3.7.5 |
| 2 | 172.22.1.9 | 2024-01-25 22:52:47+01:00 | GET | /forwardinghosts.php | 200 | 27 | - | rspamd-3.7.5 |
| 3 | 172.22.1.13 | 2024-01-25 22:53:18+01:00 | GET | / | 200 | 15 | - | check_http/v (nagios-plugins 2.4.5) |
| 4 | 172.22.1.9 | 2024-01-25 22:53:28+01:00 | GET | /bcc.php | 200 | 5 | - | rspamd-3.7.5 |
| ... | ... | ... | ... | ... | ... | ... | ... | ... |
| 99223 | 172.22.1.13 | 2024-02-09 13:30:18+01:00 | HEAD | /forwardinghosts.php | 200 | 0 | - | rspamd-3.7.5 |
| 99224 | 172.22.1.13 | 2024-02-09 13:30:18+01:00 | GET | /forwardinghosts.php | 200 | 27 | - | rspamd-3.7.5 |
| 99225 | 172.22.1.11 | 2024-02-09 13:30:28+01:00 | GET | / | 200 | 15 | - | check_http/v (nagios-plugins 2.4.5) |
| 99226 | 172.22.1.13 | 2024-02-09 13:31:11+01:00 | HEAD | /settings.php | 304 | 0 | - | rspamd-3.7.5 |
| 99227 | 172.22.1.13 | 2024-02-09 13:31:16+01:00 | HEAD | /forwardinghosts.php | 200 | 0 | - | rspamd-3.7.5 |
99228 rows × 8 columns
Checking for 404 statuses
After parsing the logs I will filter them to find rows with 404 statuses and what IP addresses produce those 404 responses. This way I can find out what potential attackers are looking for on my webserver.
df_404 = df[df['Status'] == 404]

ip_counts = df_404['IP'].value_counts()
ip_counts.head()
18.220.189.99     63
91.92.120.113     2
18.220.189.99     2
193.33.111.195    1
137.59.109.154    1
Name: IP, dtype: int64
So it seems, that there is one IP address that really stands out. This address should be blocked.
Checking for endpoints with most 404 statuses
df_404 = df[df['Status'] == 404]

url_counts = df_404['URL'].value_counts()
url_counts.head()
/wp-login.php                                                                          22
/enhancecp                                                                              6
/.env                                                                                   2
/owa/auth/logon.aspx?replaceCurrent=1&url=https%3A//owa.deb-host-01.domain.com/owa/     2
/owa/auth/logon.aspx?replaceCurrent=1&url=http%3A//owa.deb-host-01.domain.com/owa/      2
Name: URL, dtype: int64
But when it comes to endpoints with the most 404 statuses /wp-login.php stands out. So it seems attackers are looking for Wordpress admin interfaces they can attack. Luckily I do not use Wordpress and therefore I do not have to care about securing a wordpress installation.
df_404 = df[df['Status'] == 404]

user_agent_counts = df_404['UserAgent'].value_counts()
user_agent_counts.head()
Mozilla/5.0 (X11; Fedora; Linux x86_64; rv:94.0) Gecko/20100101 Firefox/95.0                                                  22
Mozilla/5.0 (compatible; wpbot/1.0; +https://forms.gle/ajBaxygz9jSR8p8G9)                                                      6
Mozilla/5.0 (Windows NT 10.0; WOW64; rv:47.0) Gecko/20100101 Firefox/47.0                                                      2
Mozilla/5.0 (Windows NT 10.0; WOW64; Trident/7.0; rv:11.0) like Gecko                                                          2
Mozilla/5.0 (Linux; Android 9; SM-G950U1) AppleWebKit/537.36 (KHTML, like Gecko) Chrome/76.0.3809.111 Mobile Safari/537.36     1
Name: UserAgent, dtype: int64
Just out of curiosity I check for the most used user agents when it comes to 404 statuses. Most used user agent is by far Mozilla/5.0 (X11; Fedora; Linux x86_64; rv:94.0) Gecko/20100101 Firefox/95.0 . This means attackers are using Linux servers for automating their directory scanning, which is not a big surprise.
Creating a detection rule with Sigma and map it to the MITRE ATT&CK framework
With the knowledge I gained in the previous investigations of my log data, I now can create some detection rules to detect those attacks.
The following rule alerts when a single IP address produces more than 30 404 status responses within 24 hours:
title: Excessive 404 errors from same IP address
id: ip-404-excessive
description: Triggers when the same IP address generates more than 30 404 errors within a 24-hour period.
status: experimental
author: Lars
date: 2023/02/09

references:
  - title: Sigma Project
    url: https://github.com/SigmaHQ/sigma

logsource:
  category: webserver
  product: nginx
  condition: '"404"'

detection:
  condition: >
    count() by $ip_address > 30
    and date_diff(@timestamp, 1d) < 1

falsepositives:
  - Misconfigured or malfunctioning clients repeatedly hitting 404 endpoints

level: low

tags:
  - attack.t1595
  - attack.t1499
  - attack.t1565
  - attack.t1583
MITRE ATT&CK framework
For better context I mapped some attack techniques of the MITRE ATT&CK framework to the rule. This way I can identify what techniques are used the most by attackers.
T1595: Active Scanning - This technique involves adversaries attempting to discover information about the network and the systems connected to it. Generating a high number of 404 errors could indicate an attacker is actively scanning for valid URLs or attempting to discover hidden directories or files.
T1499: Endpoint Denial of Service - If the excessive 404 errors are part of an attempt to overwhelm the web server, it could fall under this technique. By sending a large number of requests that result in 404 errors, an attacker might aim to consume server resources and degrade the performance or availability of the web service.
T1565: Data Manipulation - In scenarios where the attacker aims to manipulate data through unauthorized web requests that result in 404 errors, attempting to explore or exploit weaknesses in the web application’s handling of non-existent resources.
T1583: Acquire Infrastructure: Web Services - Part of the preparation phase, where attackers might be probing to identify vulnerable web services they could exploit or hijack for hosting malicious content, command and control (C2) communication, or other purposes.