In cyber security effective log management is crucial for analyzing incidents, hunt for threats, and identify anamolies. This post will show how to setup a complete log ingestion pipeline using Fluent Bit on a Debian system, collecting logs from various sources and sending them to OpenSearch for analysis and visualization. With the logs ingested into OpenSearch it is possible to build dashboards, apply threat detection rules and hunt for threats. This should be the foundation of every defensive cyber security homelab.
Fluent Bit?
Fluent Bit is a lightweight, high-performance log processor and forwarder that enables you to collect data and logs from different sources, process them, and send them to multiple destinations. Unlike its big brother Fluentd, Fluent Bit is designed to be:
- Lightweight: Uses minimal system resources (memory footprint under 650KB)
- Fast: Written in C with performance in mind
- Flexible: Supports multiple input sources and output destinations
- Cloud-native: Perfect for containerized environments and edge computing
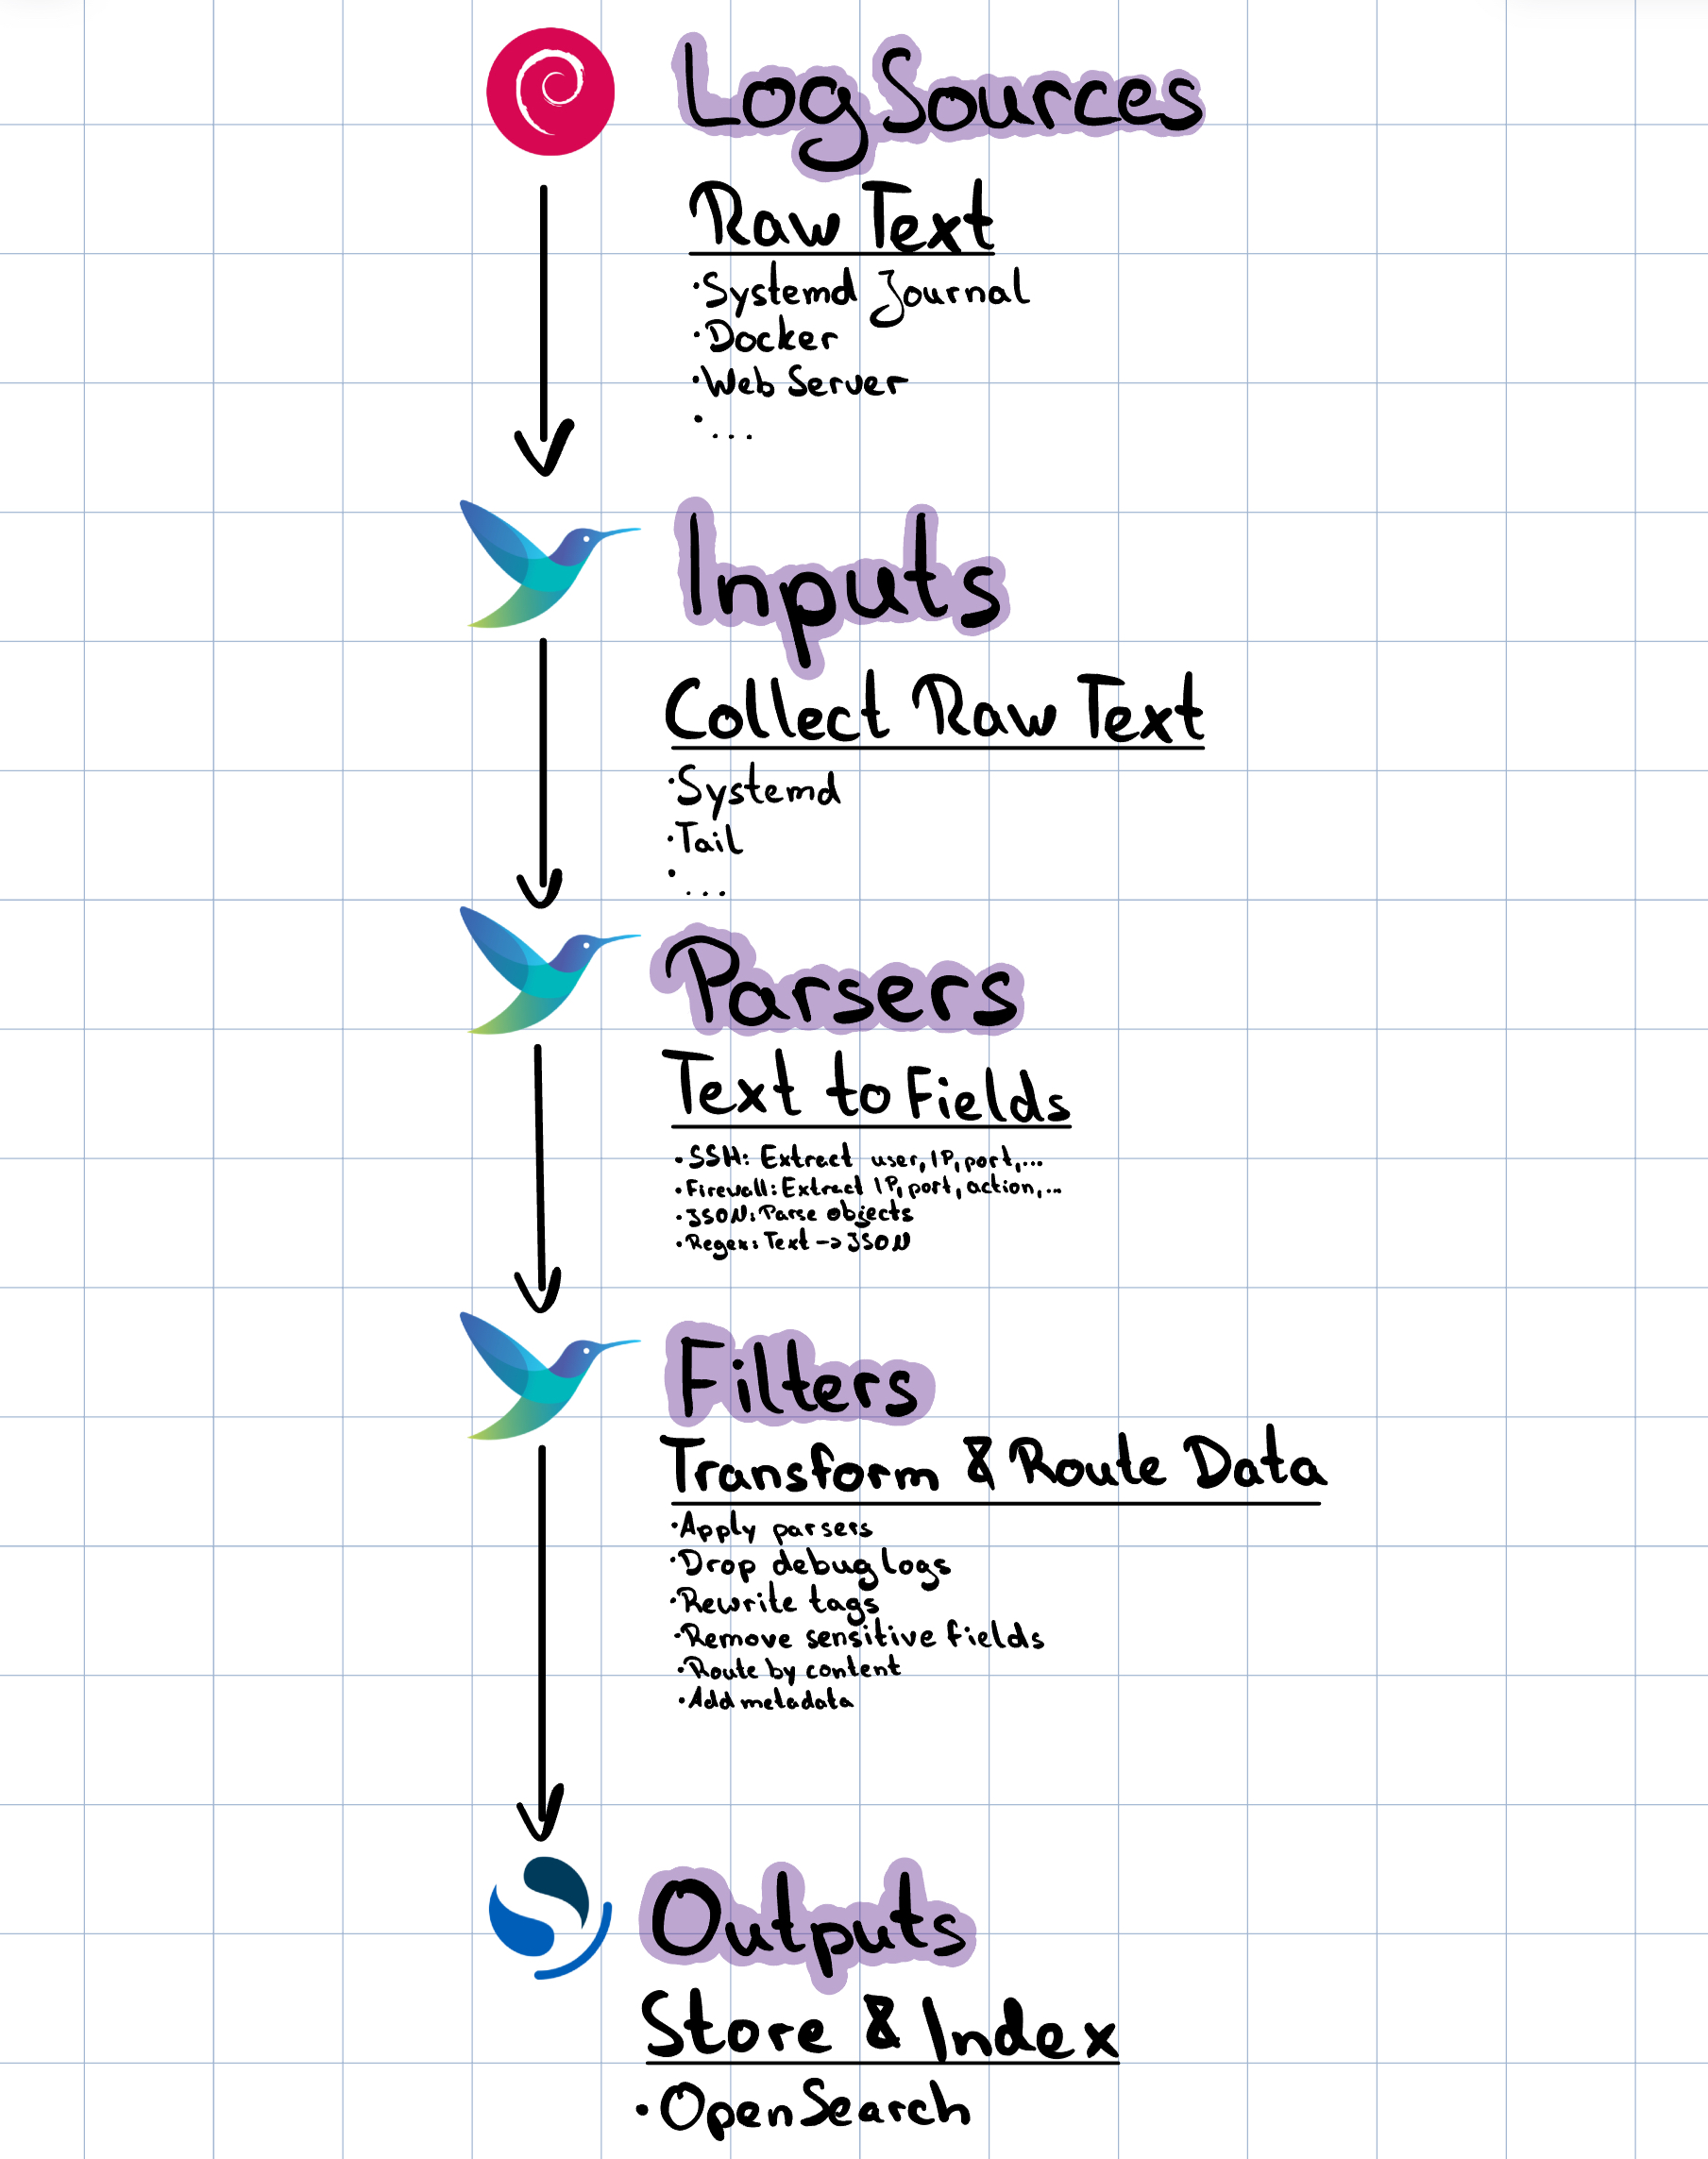
It picks up data from various locations (inputs), processes and organizes it (parsers and filters), and delivers it to the right destinations (outputs).
Architecture Overview
Here you can see the different components of Fluent Bit and how the log processing pipeline works:
Data Flow
- Collection: Fluent Bit reads logs from various sources (systemd journal, files, containers)
- Processing: Raw log data is parsed into structured fields and filtered
- Routing: Processed logs are tagged and routed to appropriate outputs
- Delivery: Logs are sent to OpenSearch with proper indexing and formatting
Installation and Setup
The installation of Fluent Bit is simple and can be automatted with tools like Ansible. Once setup and installed software updates are installed automatically using the apt package manager.
Installing Fluent Bit on Debian
# Add Fluent Bit GPG key
curl https://packages.fluentbit.io/fluentbit.key | gpg --dearmor > /usr/share/keyrings/fluentbit-keyring.gpg

# Add Fluent Bit repository
echo "deb [signed-by=/usr/share/keyrings/fluentbit-keyring.gpg] https://packages.fluentbit.io/debian/bullseye bullseye main" > /etc/apt/sources.list.d/fluent-bit.list

# Update package list and install
apt update
apt install fluent-bit

# Enable and start the service
systemctl enable fluent-bit
systemctl start fluent-bit
Directory Structure
The Fluent Bit configuration follows a modular approach and is set up as you can see below:
/etc/fluent-bit/
├── fluent-bit.conf          # Main configuration file
├── parsers.conf             # Parser definitions
├── inputs/                  # Input configurations
│   ├── systemd.conf
│   ├── docker.conf
│   └── ...
├── filters/                 # Filter configurations
│   ├── parsers.conf
│   ├── common.conf
│   └── ...
├── outputs/                 # Output configurations
│   ├── opensearch-system.conf
│   ├── opensearch-auth.conf
│   └── ...
└── parsers/                 # Detailed parser definitions
    ├── ssh.conf
    ├── ufw.conf
    └── ...
Simplier setups without multiple files and directories are also possible, but keeping it modular and structured makes modifications easier in the future.
Understanding the Pipeline
Main Configuration
The main configuration file (fluent-bit.conf) orchestrates the entire pipeline:
# ===========================================
# Fluent-Bit Main Configuration
# ===========================================

[SERVICE]
    Flush        5              # Flush data every 5 seconds
    Daemon       Off            # Run in foreground for systemd
    Log_Level    info           # Logging level
    Parsers_File /etc/fluent-bit/parsers.conf
    storage.path /var/lib/fluent-bit/

# Include modular configurations
@INCLUDE inputs/systemd.conf
@INCLUDE inputs/docker.conf
@INCLUDE filters/parsers.conf
@INCLUDE filters/common.conf
@INCLUDE outputs/opensearch-system.conf
The Four Main Components of FLuent-Bit
| Component | Think of it as | Purpose |
|---|---|---|
| Input | “Where logs enter” | Collects raw log data from sources |
| Parser | “How text becomes data” | Converts unstructured text into structured fields |
| Filter | “How data is modified” | Enriches, filters, or transforms the data |
| Output | “Where logs end up” | Sends processed logs to destinations |
Input Configuration
Systemd Journal Collection
The systemd input is perfect for collecting system logs on modern Linux distributions:
# System logs (journald, cron, kernel)
[INPUT]
    Name              systemd
    Tag               journal.system
    Systemd_Filter    _SYSTEMD_UNIT=systemd-journald.service
    Systemd_Filter    _SYSTEMD_UNIT=cron.service
    Systemd_Filter    _SYSTEMD_UNIT=kernel
    Strip_Underscores On        # Clean up field names
    Read_From_Tail    On        # Start from end of log

# Authentication logs
[INPUT]
    Name              systemd
    Tag               journal.auth
    Systemd_Filter    SYSLOG_FACILITY=4      # Auth facility
    Systemd_Filter    SYSLOG_FACILITY=10     # Auth private facility
    Systemd_Filter    _SYSTEMD_UNIT=sshd.service
    Systemd_Filter    _COMM=sudo
    Strip_Underscores On
    Read_From_Tail    On
Key Configuration Options Explained:
- Tag: Labels the data stream for routing in filters and outputs
- Systemd_Filter: Filters journal entries based on systemd fields
- Strip_Underscores: Removes leading underscores from field names for cleaner output
- Read_From_Tail: Starts reading from the end of logs (important for existing systems)
Docker Container Logs
[INPUT]
    Name              docker
    Tag               docker.*
    Docker_Mode       On
    Docker_Mode_Flush 5
    Docker_Mode_Parser container_firstline
This input automatically discovers running containers and collects their logs with container metadata.
Log Parsing
Parsing transforms unstructured log lines into structured data. This is one of the most important steps!
To have normalized field names over all indices it makes sense to use a naming standard like elastics ECS (Elastic Common Schema).
https://www.elastic.co/docs/reference/ecs/ecs-field-reference
SSH Log Parser Example
SSH logs contain valuable security information, but they’re in text format. Here’s how we parse a failed SSH login:
Raw Log Line:
Failed password for invalid user admin from 192.168.1.100 port 22 ssh2
A great tool to write and test regular expressions is regex101.com: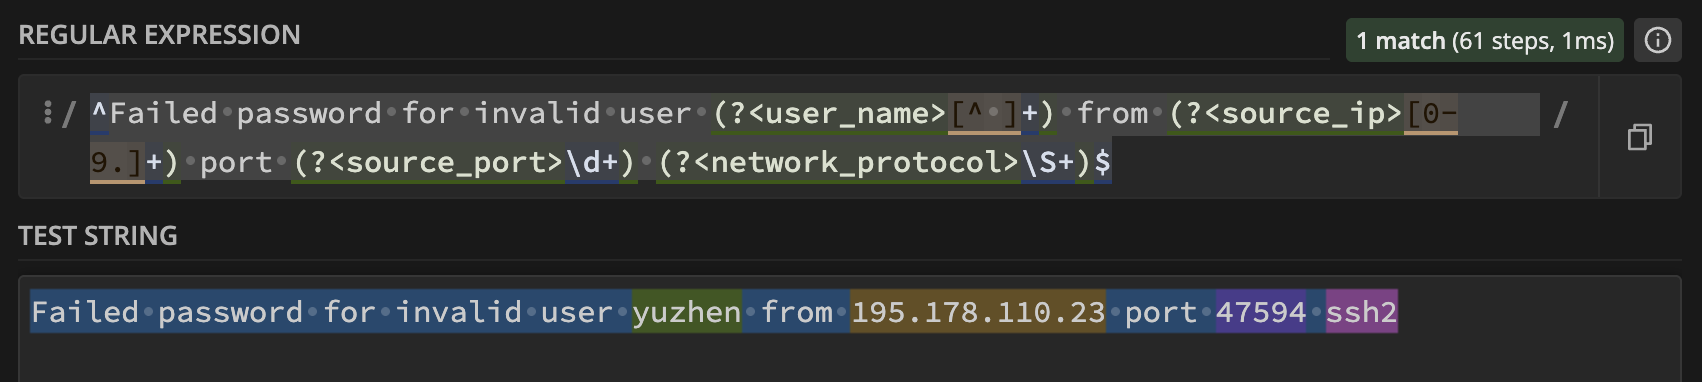
Parser Configuration:
# Failed password for invalid user admin from 192.168.1.100 port 22 ssh2
[PARSER]
    Name        ssh_failed_invalid_user
    Format      regex
    Regex       /^Failed password for invalid user (?<ssh_user>[^ ]+) from (?<src_ip>[0-9.]+) port (?<src_port>\d+) (?<protocol>\S+)$/
Parsed Output (JSON):
{
    "ssh_user": "admin",
    "src_ip": "192.168.1.100",
    "src_port": "22",
    "protocol": "ssh2",
    "message": "Failed password for invalid user admin from 192.168.1.100 port 22 ssh2",
    "timestamp": "2025-11-13T10:30:45.123Z"
}
Understanding Regex Parsers
Let’s break down the regex pattern:
/^Failed password for invalid user (?<ssh_user>[^ ]+) from (?<src_ip>[0-9.]+) port (?<src_port>\d+) (?<protocol>\S+)$/
^Failed password for invalid user- Literal text match(?<ssh_user>[^ ]+)- Named group capturing the username (anything except spaces)from- Literal text(?<src_ip>[0-9.]+)- Named group capturing IP addressport- Literal text(?<src_port>\d+)- Named group capturing port number- Space(?<protocol>\S+)$- Named group capturing protocol (non-whitespace characters) until end of line
Multiple Parser Strategy
Complex logs often require multiple parsers. SSH logs have many different message formats:
# Successful login
[PARSER]
    Name        ssh_accepted_password
    Format      regex
    Regex       /^Accepted password for (?<ssh_user>[^ ]+) from (?<src_ip>[0-9.]+) port (?<src_port>\d+) (?<protocol>\S+)$/

# Too many failed attempts
[PARSER]
    Name        ssh_too_many_failures
    Format      regex
    Regex       /^Disconnecting authenticating user (?<ssh_user>[^ ]+) (?<src_ip>[0-9.]+) port (?<src_port>\d+): Too many authentication failures \[(?<auth_stage>[^\]]+)\]$/

# Session management
[PARSER]
    Name        ssh_session_opened
    Format      regex
    Regex       /^pam_unix\(sshd:session\): session opened for user (?<ssh_user>[^(]+)\(uid=(?<uid>\d+)\) by \(uid=(?<by_uid>\d+)\)$/
Filtering and Processing
Filters modify and enrich log data as it flows through the pipeline.
Parser Filter Application
The parser filter applies our regex parsers to incoming log data:
[FILTER]
    Name                parser
    Match               journal.auth
    Key_Name            MESSAGE        # Field containing the log message
    Parser              ssh_failed_invalid_user
    Parser              ssh_failed_password
    Parser              ssh_accepted_password
    Parser              ssh_session_opened
    Parser              ssh_session_closed
    Preserve_Key        On             # Keep original message
    Reserve_Data        On             # Keep unparsed fields
How Multi-Parser Filtering Works:
- Fluent Bit tries the first parser (
ssh_failed_invalid_user) - If it doesn’t match, tries the second parser (
ssh_failed_password) - Continues until a parser matches or all parsers are exhausted
- If no parser matches, the log passes through unchanged
Tag Rewriting for Routing
Tags determine where logs go. We can modify tags based on parsed content:
[FILTER]
    Name                rewrite_tag
    Match               journal.auth
    Rule                $ssh_user ^(root|admin|administrator)$ auth.privileged_user false
    Rule                $src_ip ^192\.168\. auth.internal false
    Rule                $src_ip ^10\. auth.internal false
    Rule                $MESSAGE Failed auth.failed false
    Rule                $MESSAGE Accepted auth.success false
    Emitter_Name        auth_rewriter
This creates new tags based on content:
auth.privileged_userfor root/admin login attemptsauth.internalfor internal IP addressesauth.failedfor failed authentication attemptsauth.successfor successful logins
Data Enrichment
Add contextual information to logs:
[FILTER]
    Name                modify
    Match               auth.*
    Add                 log_type security
    Add                 source_system ${HOSTNAME}
    Add                 environment production
This adds metadata fields to every authentication log, making them easier to search and analyze.
OpenSearch Integration
OpenSearch (the open-source fork of Elasticsearch) receives our processed logs for storage and analysis.
Output Configuration
[OUTPUT]
    Name                opensearch
    Match               auth.*
    Host                192.168.4.33
    Port                9200
    HTTP_User           logstash
    HTTP_Passwd         P@$$w0rD123456
    Index               logs-auth
    Type                _doc
    Logstash_Format     On              # Use Logstash naming convention
    Logstash_Prefix     logs-auth       # Index prefix
    Logstash_DateFormat %Y.%m.%d        # Date format for index names
    Generate_ID         On              # Generate unique document IDs
    Retry_Limit         5               # Retry failed sends
    Suppress_Type_Name  On              # Modern OpenSearch compatibility
    tls                 On              # Use encryption
    tls.verify          Off             # Skip certificate verification (for self-signed)
Index Strategy
Our configuration creates daily indices:
logs-auth-2025.01.15for authentication logs on January 15, 2025logs-system-2025.01.15for system logs on the same daylogs-firewall-2025.01.15for firewall logs
This strategy provides:
- Easy retention management: Delete old indices easily
- Performance optimization: Smaller, time-based indices query faster
- Logical organization: Related logs grouped together
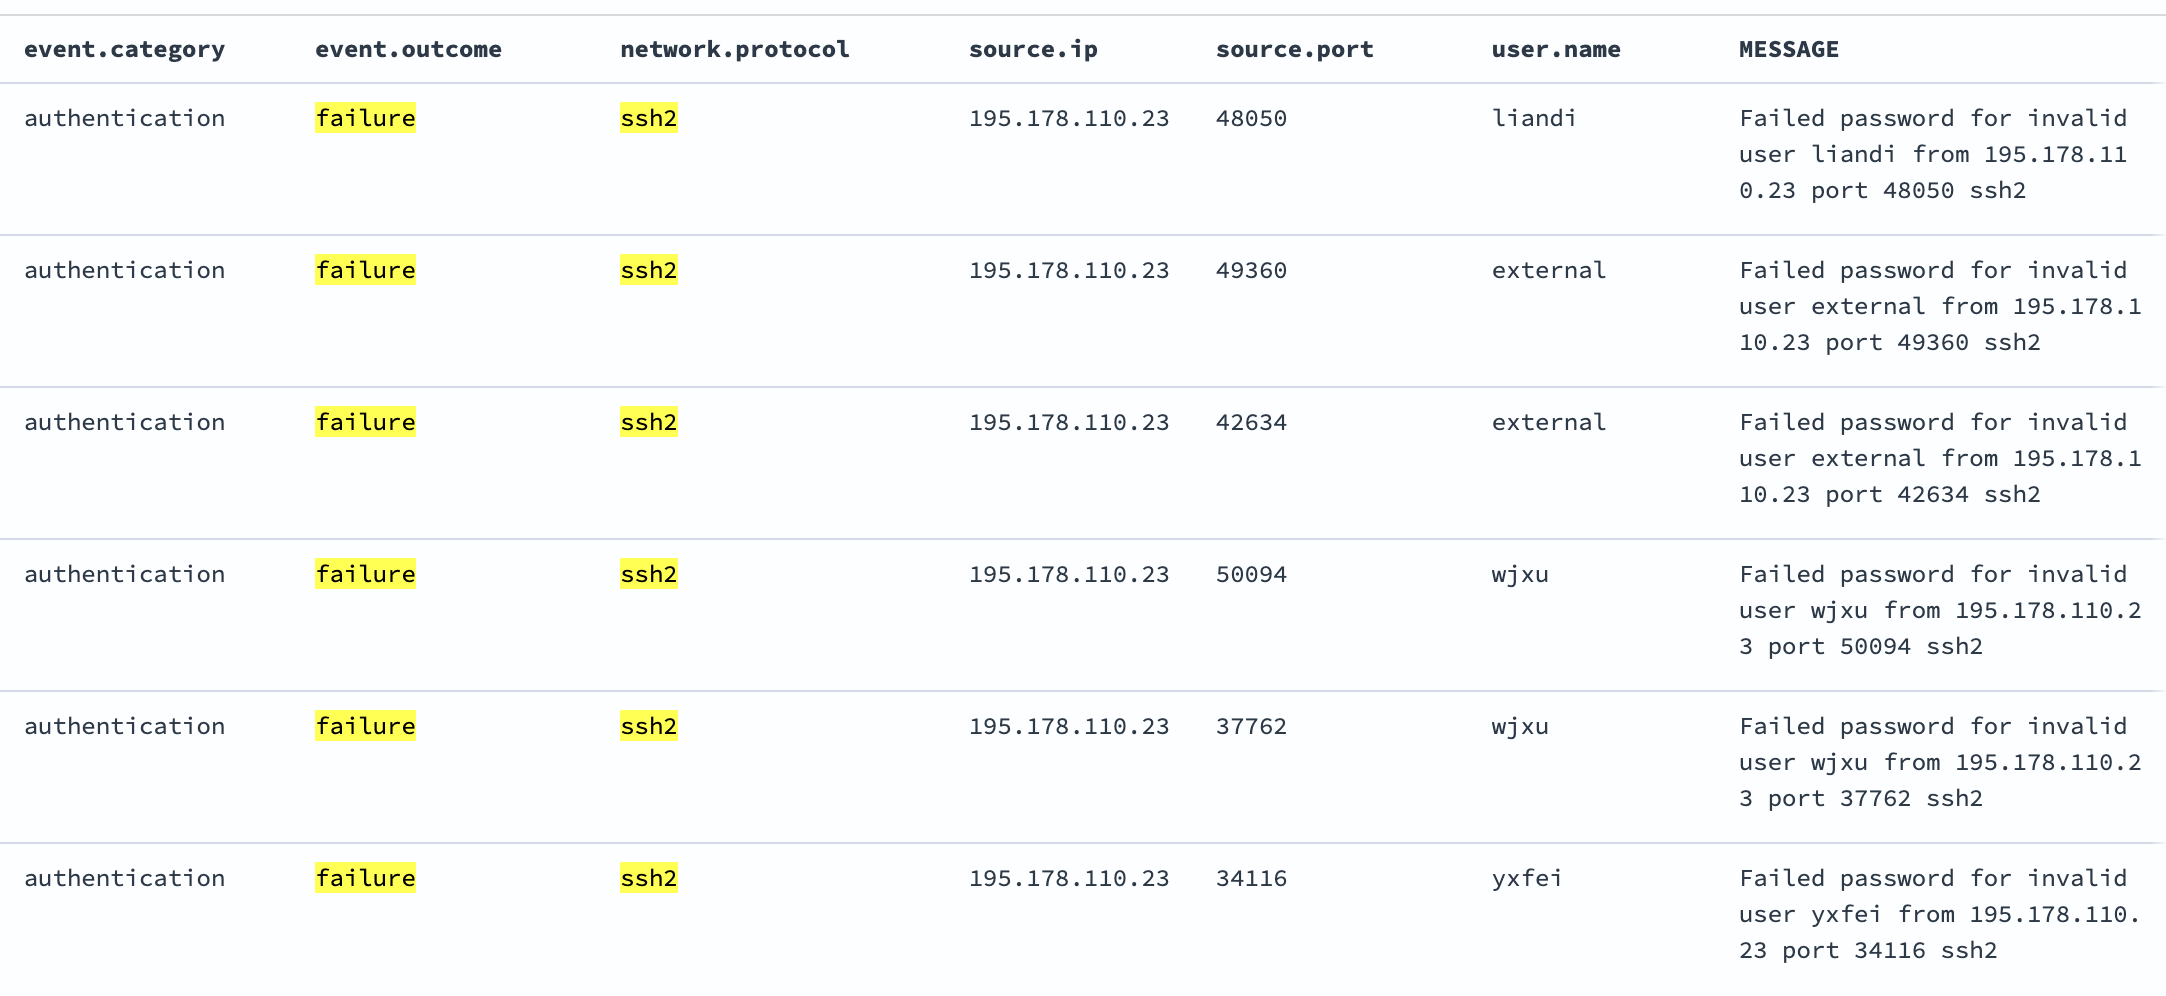
Document Structure in OpenSearch
Here’s what a processed SSH log looks like in OpenSearch:
{
  "@timestamp": "2025-01-15T10:30:45.123Z",
  "ssh_user": "admin",
  "src_ip": "192.168.1.100",
  "src_port": "22",
  "protocol": "ssh2",
  "log_type": "security",
  "source_system": "web-server-01",
  "environment": "production",
  "message": "Failed password for invalid user admin from 192.168.1.100 port 22 ssh2",
  "systemd_unit": "sshd.service",
  "priority": "6",
  "facility": "4"
}
Comparison with Other Tools
Fluent Bit vs. Elastic Agent
| Aspect | Fluent Bit | Elastic Agent |
|---|---|---|
| Resource Usage | Very low (~650KB memory) | Higher (50-200MB memory) |
| Flexibility | High - supports many outputs | Medium - Elastic Stack focused |
| Configuration | Text-based, version controllable | GUI-based (Fleet) + YAML |
| Parsing | Powerful regex and built-in parsers | Good with Elastic Common Schema |
| Learning Curve | Moderate | Easier with Elastic Stack knowledge |
| Vendor Lock-in | None - open source | Some (optimized for Elastic) |
| Updates | Manual configuration changes | Centralized Fleet management |
When to Choose Fluent Bit
Choose Fluent Bit when you need:
- Minimal resource usage (edge computing, IoT)
- Multi-destination log shipping
- Custom parsing logic
- Non-Elastic destinations (OpenSearch, Kafka, etc.)
- Fine-grained control over log processing
Choose Elastic Agent when you want:
- Seamless Elastic Stack integration
- Centralized management via Fleet
- Pre-built integrations for popular services
- Easier initial setup for Elastic-only environments
Fluent Bit vs. Other Alternatives
Filebeat:
- Lighter than Elastic Agent but heavier than Fluent Bit
- Less flexible parsing capabilities
- Better for simple log forwarding
Logstash:
- Much heavier resource usage
- More powerful filtering and processing
- Better for complex transformations
Vector:
- Similar performance to Fluent Bit
- Rust-based with strong type safety
- Good alternative with growing ecosystem
Best Practices
1. Resource Management
# Configure buffering to handle traffic spikes
[SERVICE]
    storage.path /var/lib/fluent-bit/
    storage.sync normal
    storage.checksum off
    storage.backlog.mem_limit 5M
2. Error Handling
# Add retry logic and dead letter queues
[OUTPUT]
    Name                opensearch
    Match               *
    Retry_Limit         5
    Workers             2
    # ... other config ...
3. Security Considerations
# Use environment variables for sensitive data
[OUTPUT]
    Name                opensearch
    HTTP_User           ${OPENSEARCH_USER}
    HTTP_Passwd         ${OPENSEARCH_PASSWORD}
    tls                 On
4. Monitoring and Observability
# Enable metrics endpoint
[SERVICE]
    HTTP_Server  On
    HTTP_Listen  0.0.0.0
    HTTP_Port    2020
Access metrics at http://your-server:2020/api/v1/metrics/prometheus
5. Testing Configurations
# Test configuration syntax
fluent-bit --config /etc/fluent-bit/fluent-bit.conf --dry-run

# Run with verbose logging for debugging
fluent-bit --config /etc/fluent-bit/fluent-bit.conf --log-level debug
6. Performance Optimization
- Use appropriate flush intervals (5-30 seconds)
- Configure worker threads for outputs
- Monitor memory usage and adjust buffers
- Use storage buffering for reliability
Troubleshooting Common Issues
Parser Not Matching
# Test regex patterns
echo "Failed password for admin from 192.168.1.1 port 22 ssh2" | \
    fluent-bit --config test-parser.conf --log-level debug
OpenSearch Connection Issues
# Test connectivity
curl -u user:password https://opensearch-host:9200/_cluster/health

# Check Fluent Bit logs
journalctl -u fluent-bit -f
High Memory Usage
- Review buffer settings
- Check for parsing loops
- Monitor input rates vs. output capacity
Conclusion
Fluent Bit provides a powerful, efficient solution for log collection and processing. Its lightweight nature makes it perfect for modern infrastructures while maintaining the flexibility needed for complex log processing requirements.
Key takeaways:
- Modular configuration makes maintenance easier
- Powerful parsing transforms unstructured logs into searchable data
- Flexible routing allows sophisticated log distribution
- OpenSearch integration provides excellent analytics capabilities
- Lower resource usage compared to alternatives
Start with basic configurations and gradually add complexity as your needs grow. The investment in proper log parsing pays dividends in operational visibility and incident response capabilities.