To monitor my private IT I installed a monitoring solution based on Prometheus and Grafana. I installed it on a Raspberry Pi, to monitor my external Servers, the Raspberry Pi itself and some other things in my home network. In addition I configured some alerts to get notified when something crashes, or when some metrics are too high.
In my case I installed Prometheus server on my Raspberry Pi. The prometheus server is collecting metrics from all the devices I want to be monitored and stores it permanently with a time stamp. The devices expose the metrics with the Prometheus Node Exporter. To visualise and analyse all these metrics I use Grafana wich I also installed on the Raspberry Pi. Grafana uses all the metrics that are collected from the Prometheus server to query and visualise all the data.
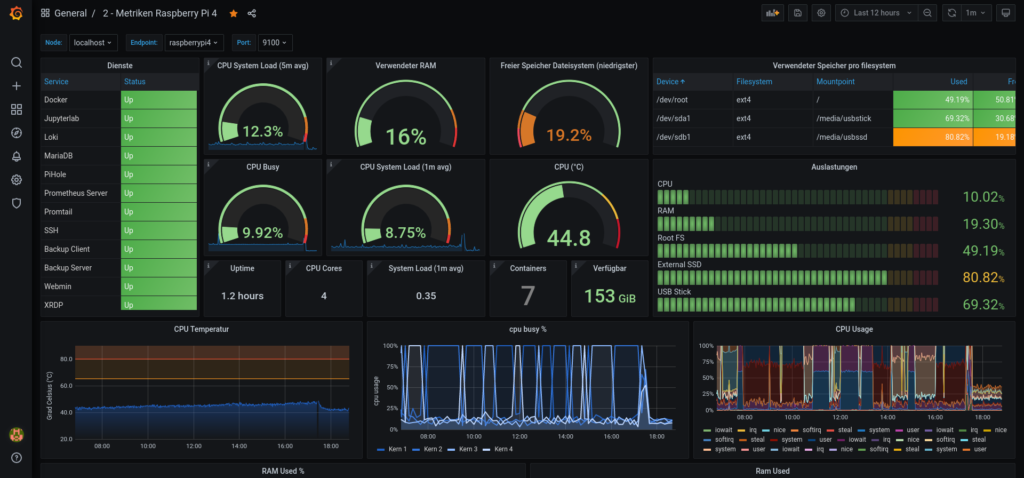
To always have an overview about the state of my private IT, I build some dashboards with all the informations I am interested in. I can monitor the state of all services and I also can monitor the the used and free ressources from each device. I can even monitor the wifi quality of my wifi router and detailed network traffic.